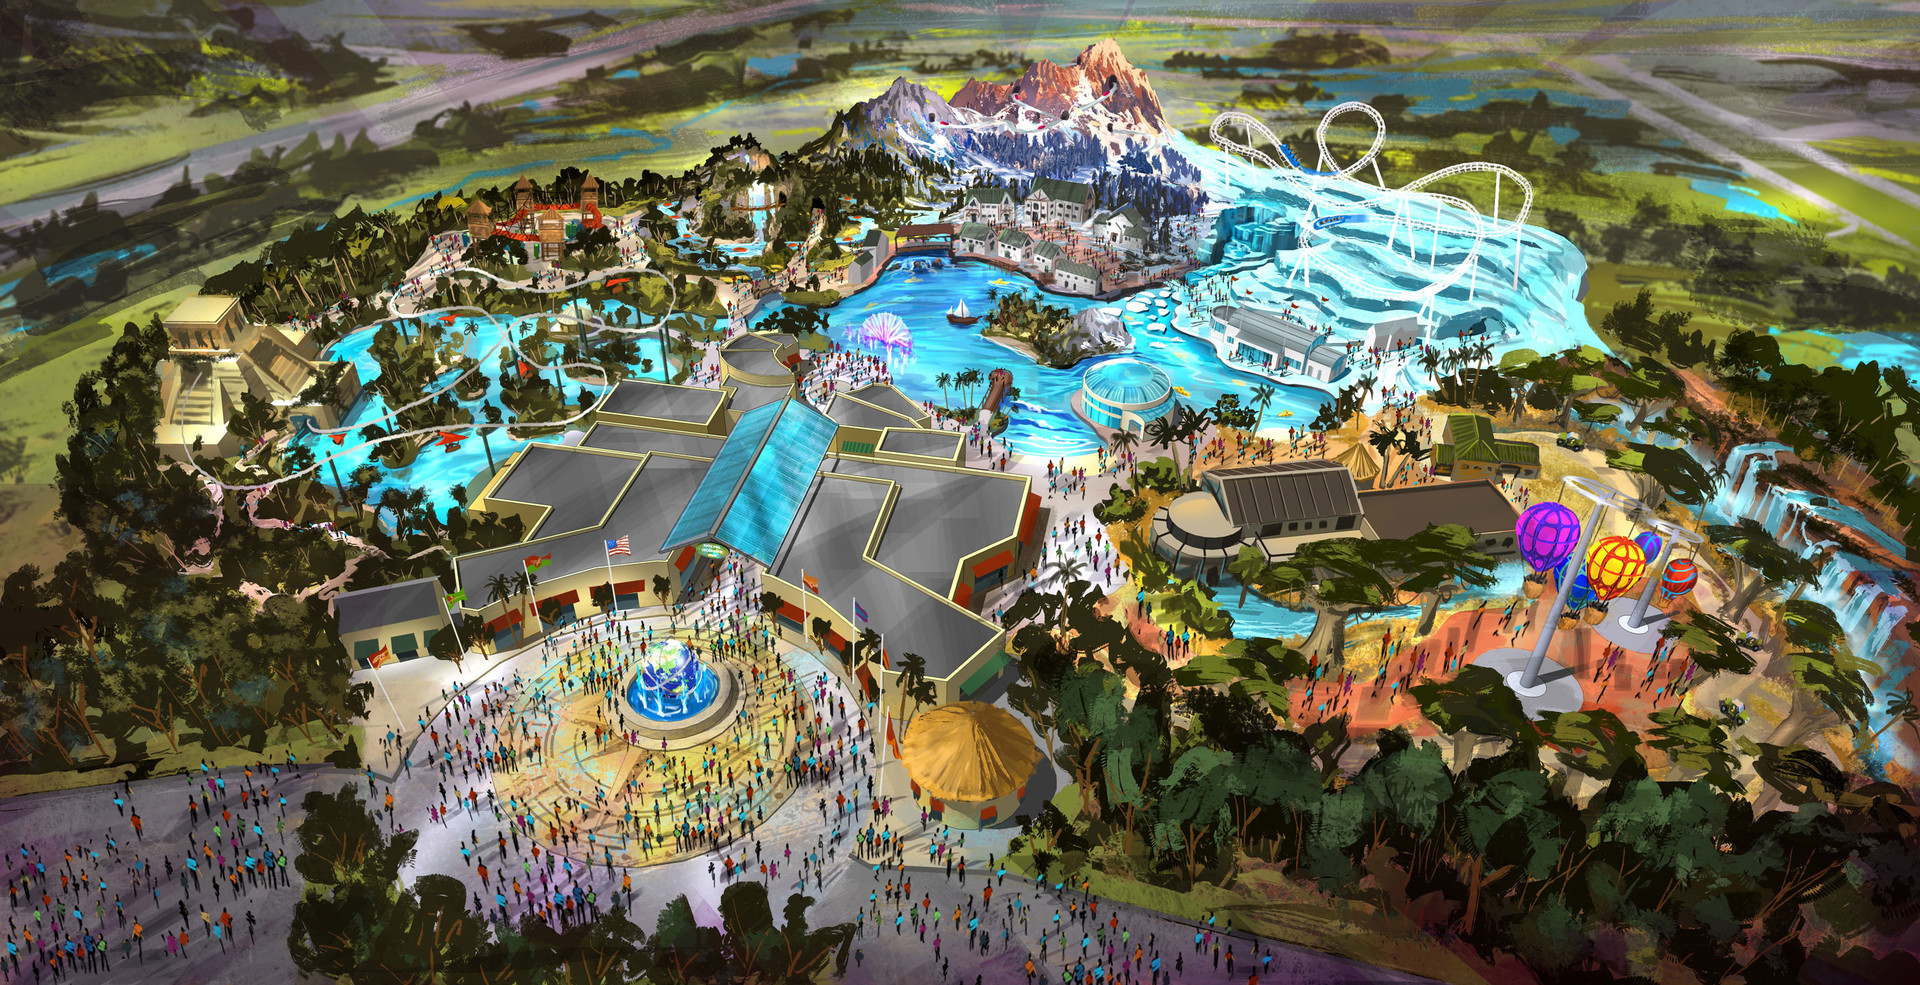
Project 4: Theme Park Factbook

I enjoy doing research, especially on things that I am passionate about. This is why this semester-long project is so special to me- it’s about something I have an undying passion for.
At the beginning of the semester, we were all instructed to pick a theme that we liked, one that we would stick with throughout the semester. After giving it some thought, I went with the interest of mine that I thought would give me the most concrete results: amusement parks. Throughout the semester, as we learned about different kinds of charts, we made our own. Most of these were made in Excel, but more complex ones were made with programs like Canva and Visme. At first, it started with charts like line graphs and pie charts, but then it eventually grew into things like chartjunk and rose charts (which, fun fact, were created by Florence Nightengale).
After all of this, I had to put all of them together in a factbook. I used Adobe InDesign to design it, making it simple and clean to appeal to a professional eye.